Saturday, 13 February 2016

Orientation: Provinces and more


As the cartogram reshuffles the country geographically, I thought I'd show you a few figures to help orientation. Here are the regions in our cartogram view. Obviously, Dublin dominates the eastern section and Munster and the rest of Leinster squeezes Connaught-Ulster into the corner.
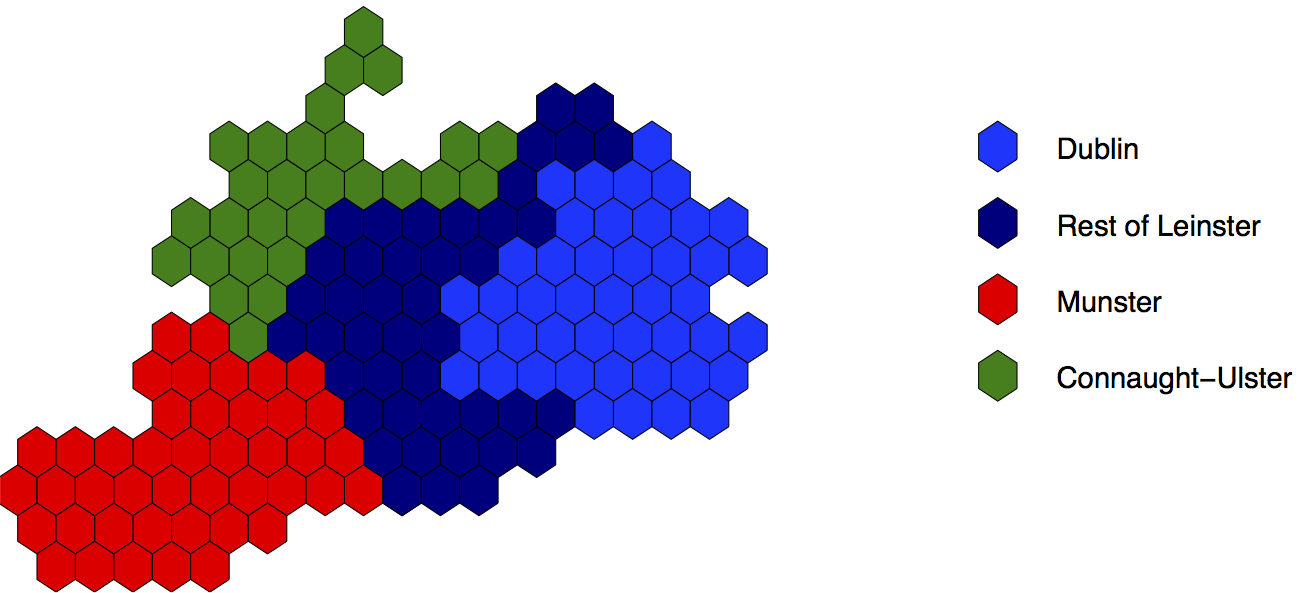

And just to hep my own diaspora to orientate themselves:


The shuffling of the hexagons in constituency shapes is still a work in progress so I've shuffled Suir-Nore-Barrow confluence a little in this iteration. 


Friday, 12 February 2016

Incumbents


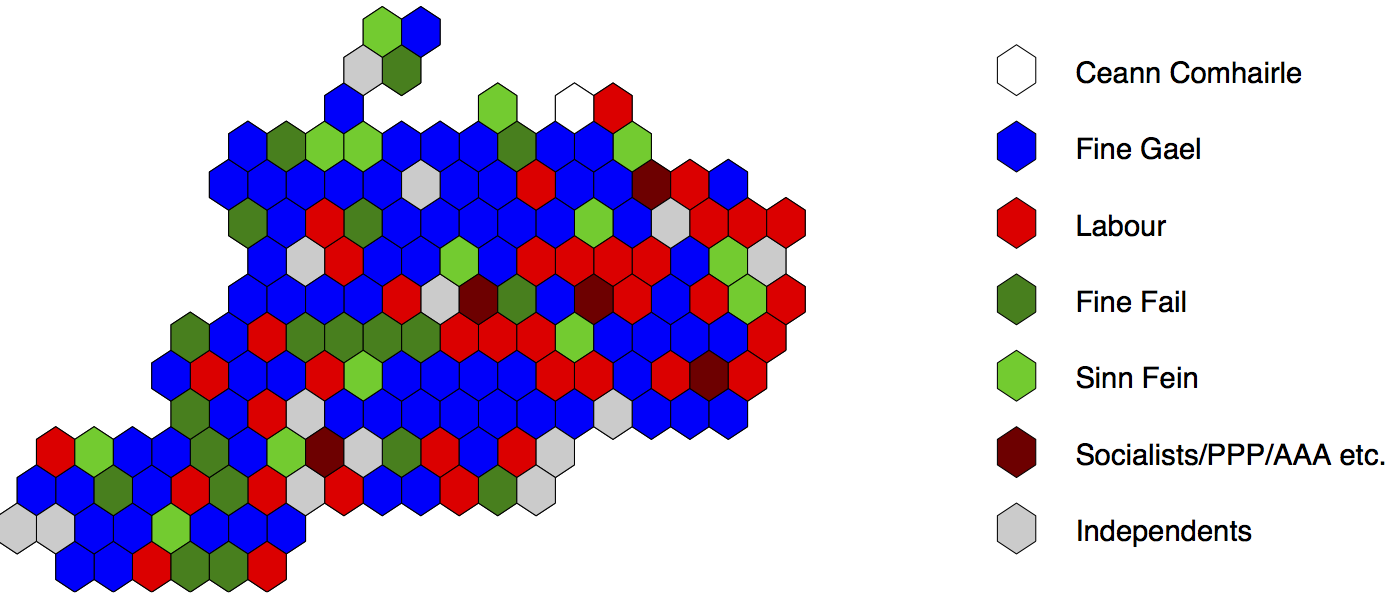
Here are the HexMyTD results for GE2011.

First of all, these aren't the incumbents—they're who won where in 2011. So this neglects Labour leavers, Fine Gael Renua-ers, by-elections etc. Also, my old renderer doesn't like fadas (I'm not trying to have a swipe at Fine Fáil).

It struck me how red and blue the map ended up. Yes, FG and Labour were the two biggest parties but I'm not sure I expected such a division. Throw in Sinn Féin and you have a real red Liffeyside going on.


Second of all, constituency changes are a pain in the ass for a part time mapper like myself. So let me know in the if I've missed your constituency (hopefully not—though it did take me a while to sort out Roscommon-Leitrim-Sligo) or favourite TD (a distinct possibility). Here is the updated legend for the 2011 constituencies.

Wednesday, 10 February 2016

A Hexagon per TD


With the Irish general election looming fast, I've been dusting off my mapping skills. 

The political geek in me loves poring over election results and the geoscientist in me loves maps.The maps in this blog combine both. 

The maps couldn't be simpler: there is one hexagon per TD. These sort of maps were all in abundance prior to the UK general election in 2015 (e.g. here's a summary) but I haven't seen one for Ireland yet.  

Using this map, we can plot the full results of the general election on a single graph—always tricky in multi-seat constituencies—and poor old Dublin doesn't need a separate map to see what is going on in the densely populated capital. 

Every hexagon is the same size so there is no population density distortion. This means that the map isn't geographically true so Dublin constituencies take over most of the eastern bulge. This map shows where your constituency lies as coloured hexagons, with a constituency list on the right hand side.